Last week I added a collection of 19 new graphs to Repeat Customer Insights.
They are based on the seven metrics used in the Store Analysis:
- Average Latency
- Average Lifetime Value (LTV)
- Average Order Value (AOV)
- Average Orders per Customer
- Average Orders per Month
- Repeat Purchase Rate (RPR)
- Repeat Sales Rate
With the graphs you can visually see how your store is performing over-time (year-by-year, quarter-by-quarter) and how customers acquired from different sources cause the metrics to vary. Just like with the Store Analysis, you can drill-down to see how a specific acquisition source performs but now with an over-time view.
Pretty useful to notice long-term trends.
Also included in this update is a new way to explore those metrics and reports that use them. Each metric list the reports that measure that metric and other related metrics. I'll also be collecting and linking to my articles for each metric to help you learn how best to use each one.
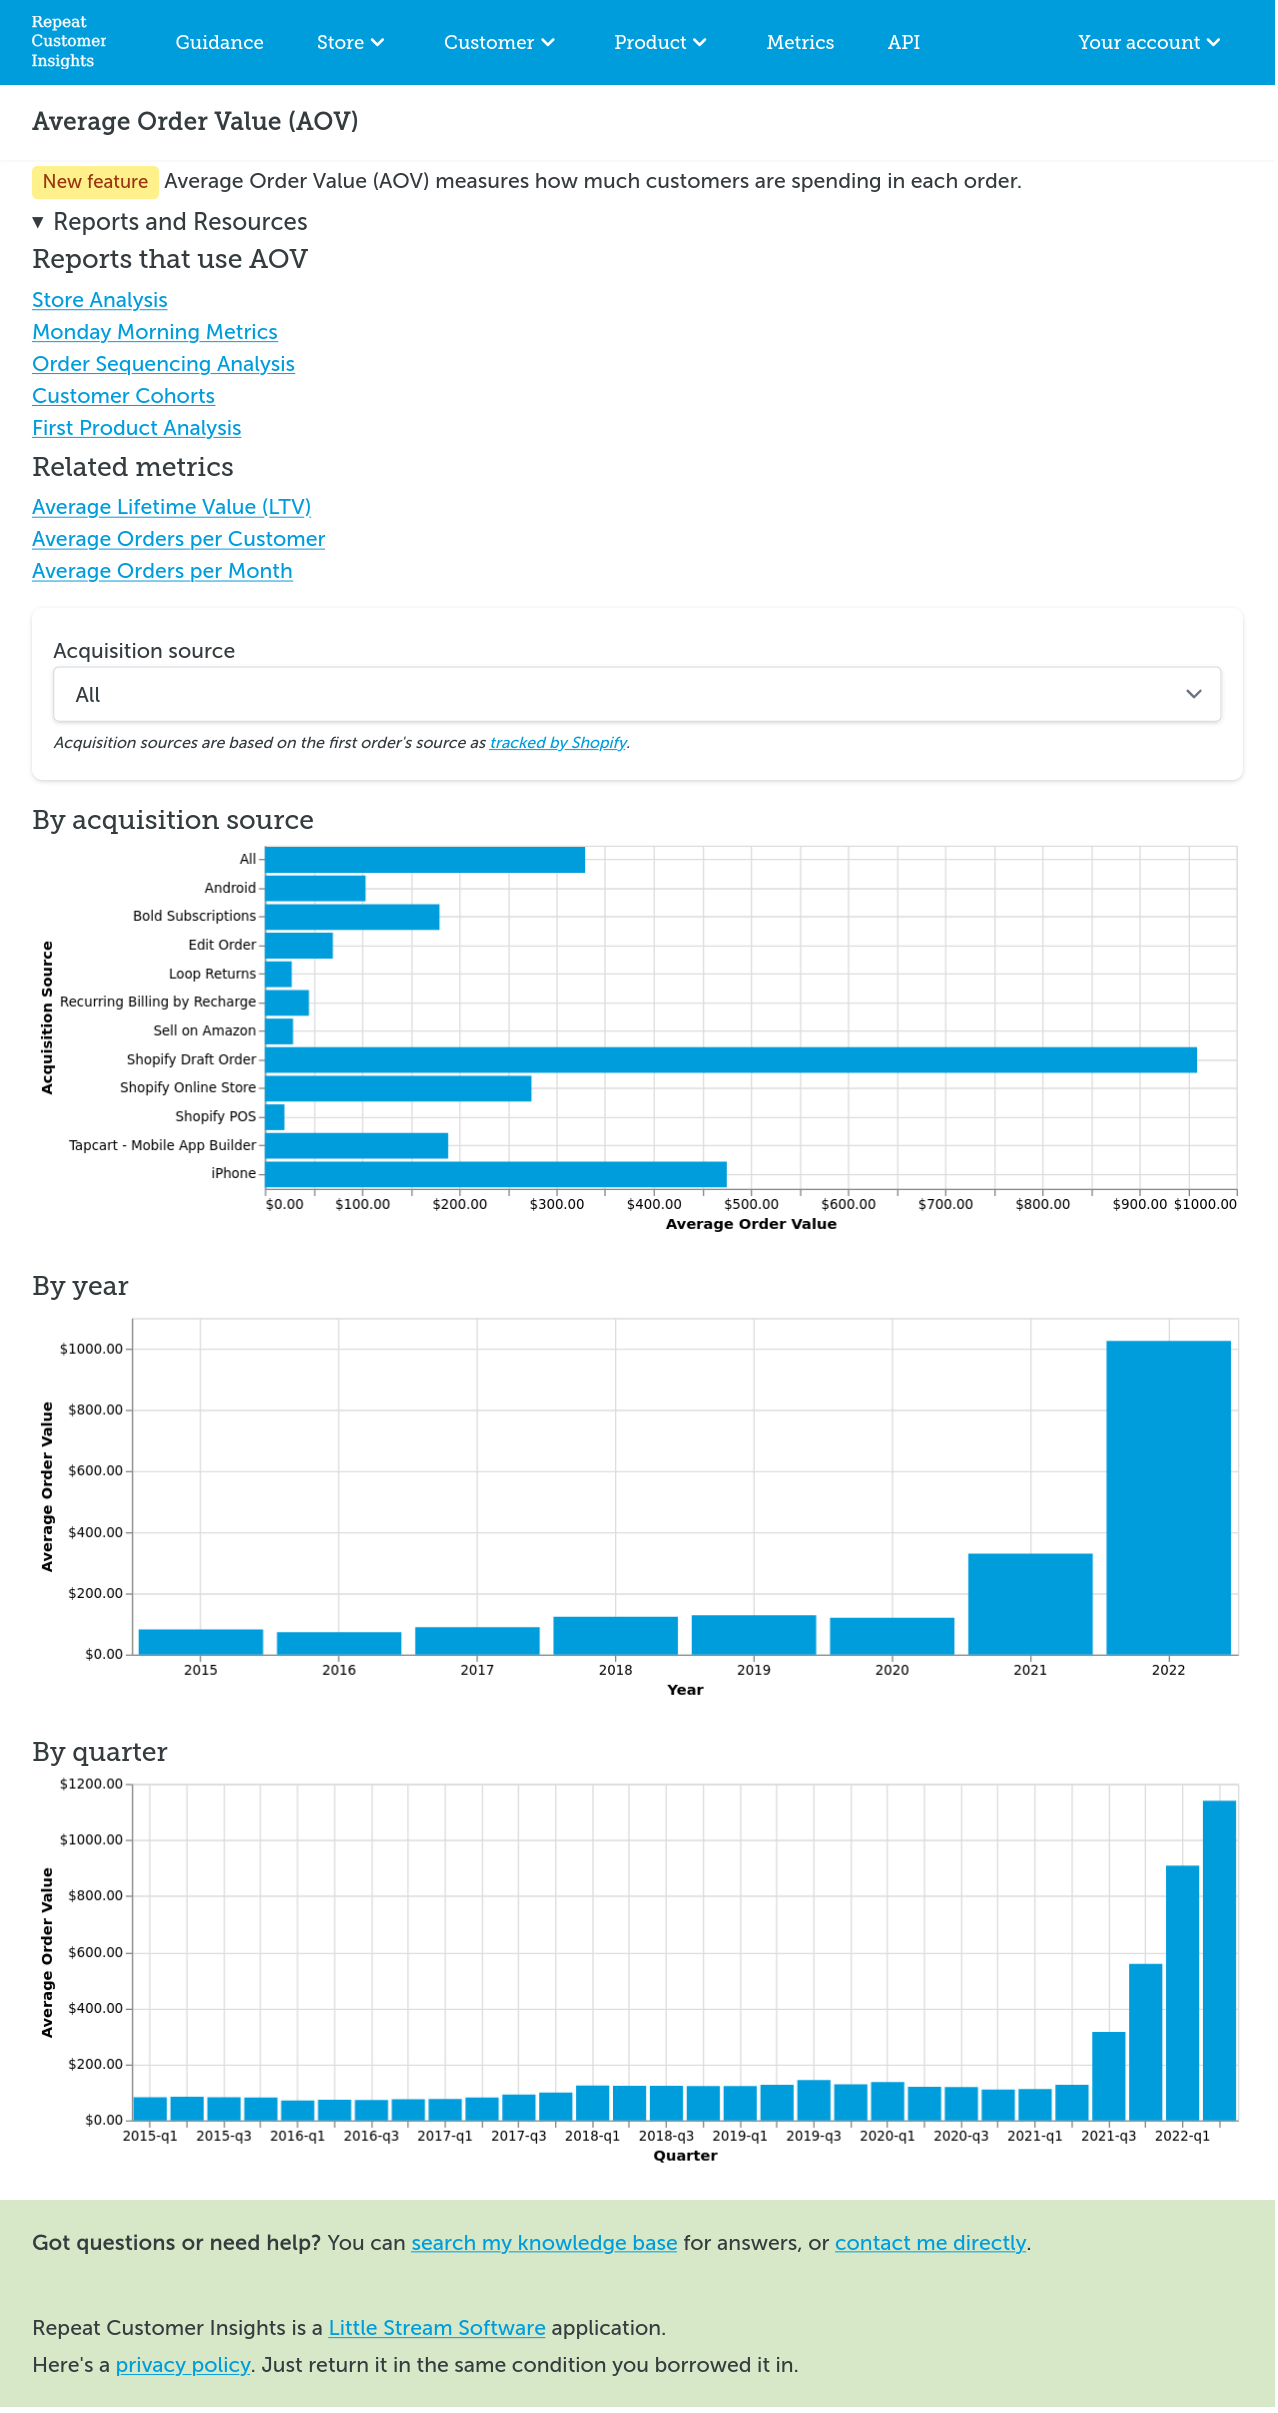
Click for the full sized version
So for example, if you're focused on improving your Average Order Value (AOV) in your store that metric page will tell you that the Store Analysis, Order Sequencing Analysis, Customer Cohorts, etc have different measurements of AOV. It'll also tell you that Average Lifetime Value, Average Orders per Customer, and Average Orders per Month are all related to the AOV.
More graphs will be added over-time as I go through each report. This batch is only about half of the graphs I've noted down but I wanted to release them early so you can start using them for the last half of 2022.
If you'd like to get metrics and advice for improving your customer retention, Repeat Customer Insights and its customer analyses can help.
Eric Davis
Retain the best customers and leave the worst for your competitors to steal
If you're having problems with customers not coming back or defecting to competitors, Repeat Customer Insights might help uncover why that's happening.
Using its analyses you can figure out how to better target the good customers and let the bad ones go elsewhere.