Your Shopify store's Average Order Value (AOV) is one of the key metrics you want to keep track of and calculate. It represents a lot of different behavior in your store and, being an average, sums them up into a single easy to reference number.
Average Order Value definition
Average Order Value shows how much each customer spends in an order, on average (hence the name).
It is calculated on orders in a date range so you'll end up with some average customers, some high value customers, and some low value customers. Your store's specific mix of different customer segments will determine what your AOV ends up at.
(That's actually one way to increase the average order value: try to get more customers on the higher end to make more purchases).
As a customer metric
It's not as useful to measure how your customer base behave. It's more of a transactional metric.
Using customer lifetime value (CLTV or LTV), customer purchase latency, or repeat purchase rate are better to measure your customer base's behavior but they are trickier to calculate.
Average Order Value, being a simple metric, is easy for any store to calculate. Even if you don't have a lot of order data to use, you can still figure out the AOV.
Calculating Average Order Value
Calculating your average order value in Shopify is quite easy. You need to know how many orders happened and the total sales for those orders. Often AOV is calculated in a date range.
For this example, let's calculate the Average Order Value for two different months, April and May 2016. Using the Sales by Month report in Shopify gives us all the data we need.
1. Find total sales for the month
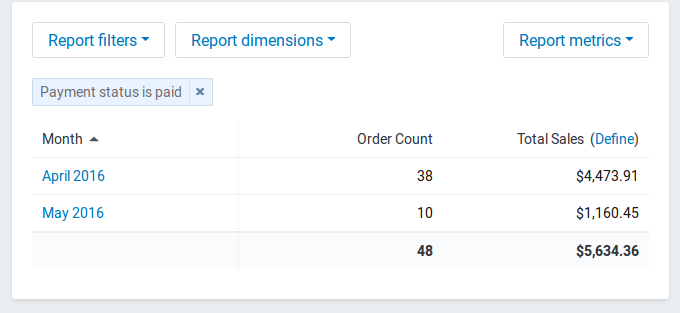
Using the Total Sales metric, you can see that April had $4,473.91 and May had $1,160.45 in total sales.
As an aside, May didn't look to good. I'd consider digging deeper into the data to see why sales dropped that much.
2. Find order count
Using the same report, Shopify shows us the number of orders for each month -- 38 for April and 10 for May.
Which also explains why May did so poorly, this store didn't have many orders.
3. Divide total sales by order count
Now to find the Average Order Value we just divide the total sales by the order count.
April
 $4473.91
--------- = $117.74
   38
May
 $1160.45
--------- = $116.04
   10
April would have an Average Order Value of $117.74 and May's would be $116.04.
Drawing conclusions
Based on these two quick calculations we can draw a few conclusions:
- our AOV has dropped in May but not a significant amount, even with the major drop in orders and sales
- our number of orders has dropped significantly so we're not acquiring as many customers as April
- each new customer we acquire should add $116 in revenue on average
- at an order volume of 100 per month, we should make $11,600 in total revenue or $116,000 for 1,000 orders per month
Average Order Value and profitability
Average Order Value doesn't look at any cost data. It's purely a revenue calculation.
That means you could be losing money with each other, even if AOV is high and growing.
If you have a stable margin, you can estimate the profitability but you'll quickly get into more complex calculations.
My advice, when using AOV is to not worry about profitability. Rather use another metric like margin to track profitability and then watch how changes in AOV impact the profitability metric.
(Personally, I don't like looking at AOV due to it's disconnect from profitability. But it's such a quick metric to calculate that even I'll glance at it now and then)
Using Average Order Value with customer acquisition
One place where Average Order Value shines is with customer acquisition. You can use it to make sure that you're acquiring customers at a low enough cost to still make a profit.
For example if your AOV is $100, customer acquisition cost is $10, and operating margin is 20%, then you're making $10 profit per order:
$100 - $80 COGS (20% margin) - $10 acquisition = $10
If customer acquisition increased to $25, now you're losing money on each order.
$100 - $80 COGS (20% margin) - $25 acquisition = -$5
But if you increased Average Order Value by the same $15, you're back in the black.
$115 - $80 COGS (20% margin) - $25 acquisition = $10
Other ways to use Average Order Value
Average Order Value is a simple calculation so it can be used in a variety of different ways. You can calculate and compare it for different time periods.
- for the month, like in the examples above
- for the year-to-date
- for the trailing 12 months
You can compare orders from different marketing channels. This will show you which channels are sending you the large and small orders (and where you should prioritize acquisition).
- orders from organic SEO traffic
- orders from Facebook posts
- orders from Facebook ads, including specific campaigns
- orders from affiliates
- orders from co-marketing
AOV is usually summarized across your entire customer base, but you can also calculate it for different segments of your customers. There are almost always hidden gems in these.
- new customers
- repeat customers
- geographic location (e.g. customers in the USA vs Canada)
My Shopify app, Repeat Customer Insights, will even combine the Average Order Value with the customer purchase latency which will tell you if repeat customers are spending more with each subsequent purchase or less.
AOV can also work with products in interesting ways.
- orders with specific products purchased (called a Market Basket Analysis)
- from customers who orders specific products in the past
- comparing different variants of the same product (blue shirt vs red shirt)
The ease of calculating makes AOV useful for these ad-hoc questions.
Average Order Value's impact on conversions rates
Sometimes when you're trying to optimization your conversion rate, you'll be told to track Average Order Value too. They aren't directly related but if your online store doesn't watch them both, you could over-optimize and weaken one metric.
If you increase your conversion rate, you'd get additional orders each month. But if in the process of that you cause your Average Order Value to drop you could lose enough profit to eat into those additional orders and perhaps deeper.
So make sure to watch Average Order Value as you optimize your store and back off any changes that negatively impact your conversion rate.
Similarly, watch your conversion rates when you're increasing your AOV to make sure you're not turning away too many orders. It's common to over-optimize for higher and higher AOVs and end up turning aside smaller orders.
Your turn
Take the next 5 minutes and calculate your Average Order Value for the last 3 months. Notice any trends? Is your AOV enough to support your operations or are you losing money with most orders?
Additionally, you might want to calculate your Repeat Purchase Rate too. It works with Average Order Value and can help you distinguish between new customer orders and repeat customer orders.
Compare how your sales perform
Comparing sales channel performance is vital to understanding where to invest your resources. Repeat Customer Insights will analyze the channels that send you customers so you can directly compare.