Repeat Customer Insights will analyze your entire customer data and equip you with reports on what your most loyal and valuable customers do. More than that, it will give you clear and actionable advice on how to keep your existing customers loyal and how to turn more of your one-off customers into loyal, repeat customers.
Advice and Data Insights
Run your data though the Insights System to perform deep analyses and comparisons. The end result? Practical advice tailored for you based on your data.
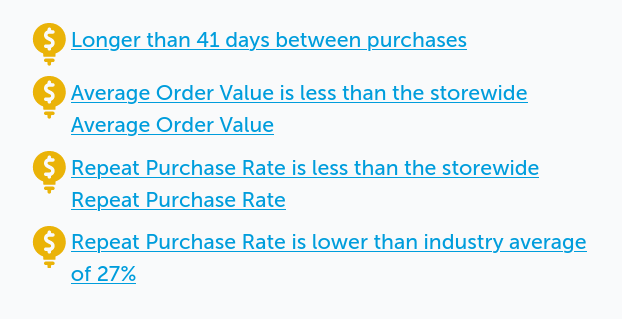
Who Are Loyal
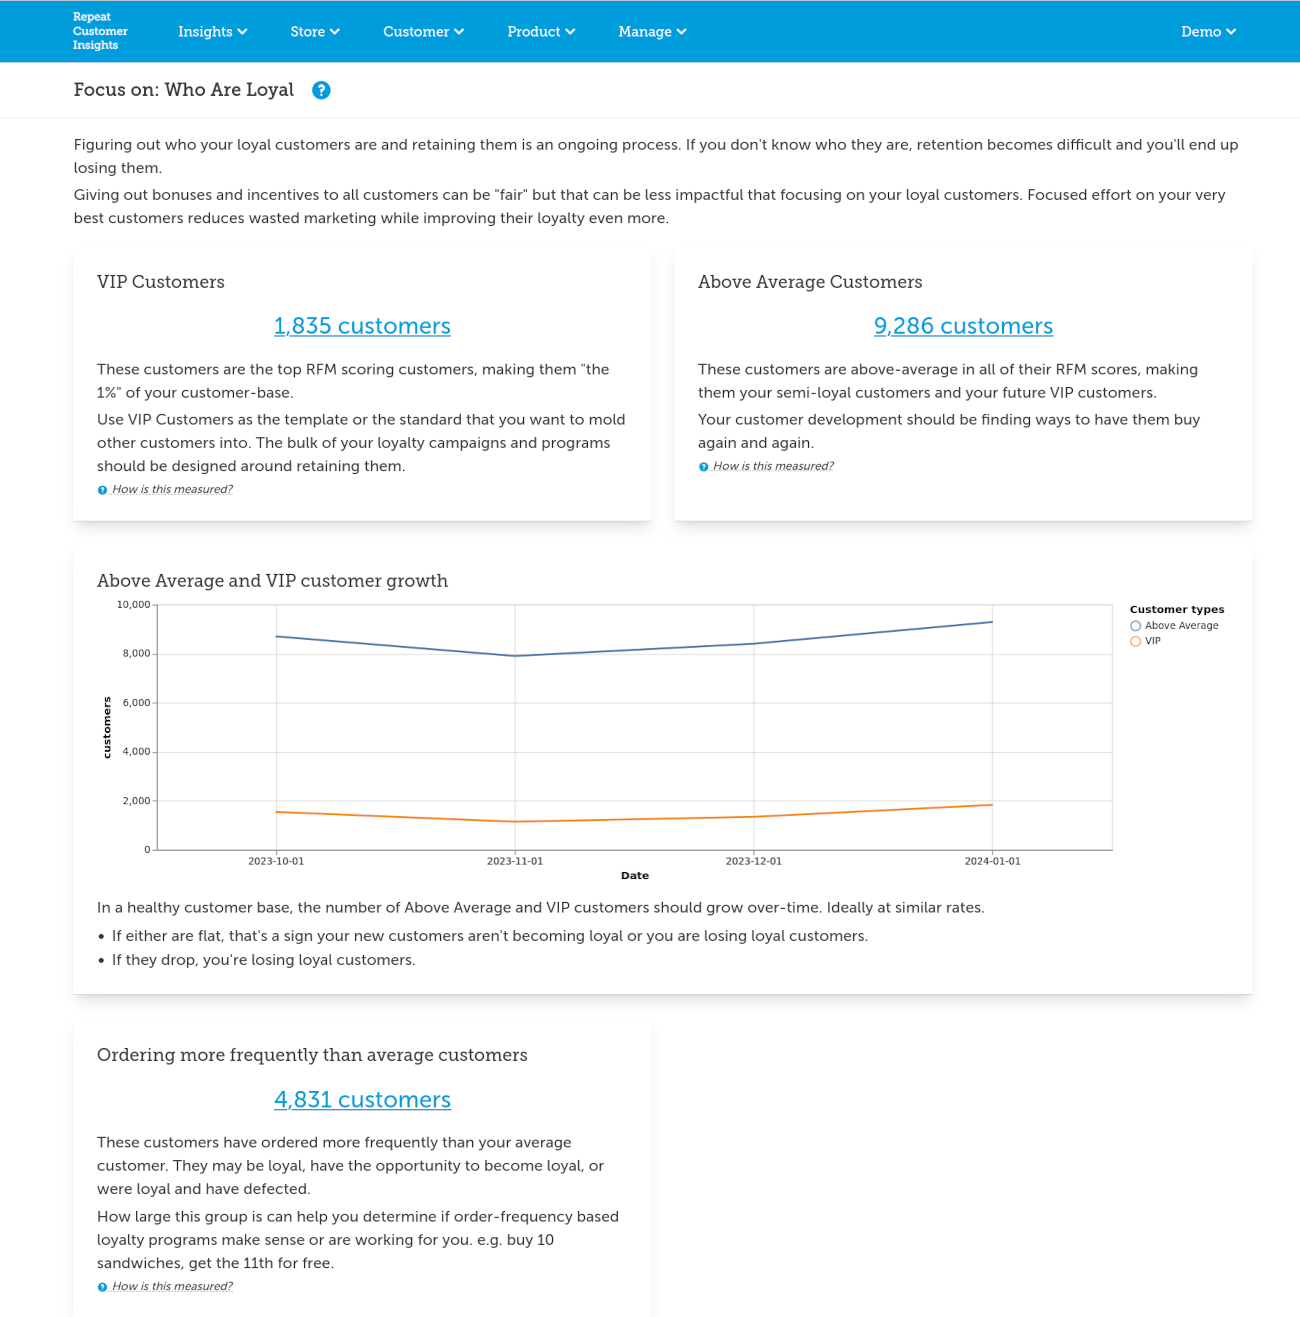
Find who your more loyal customers are so you can better retain them in the long-term.
1-to-2 Customer analysis
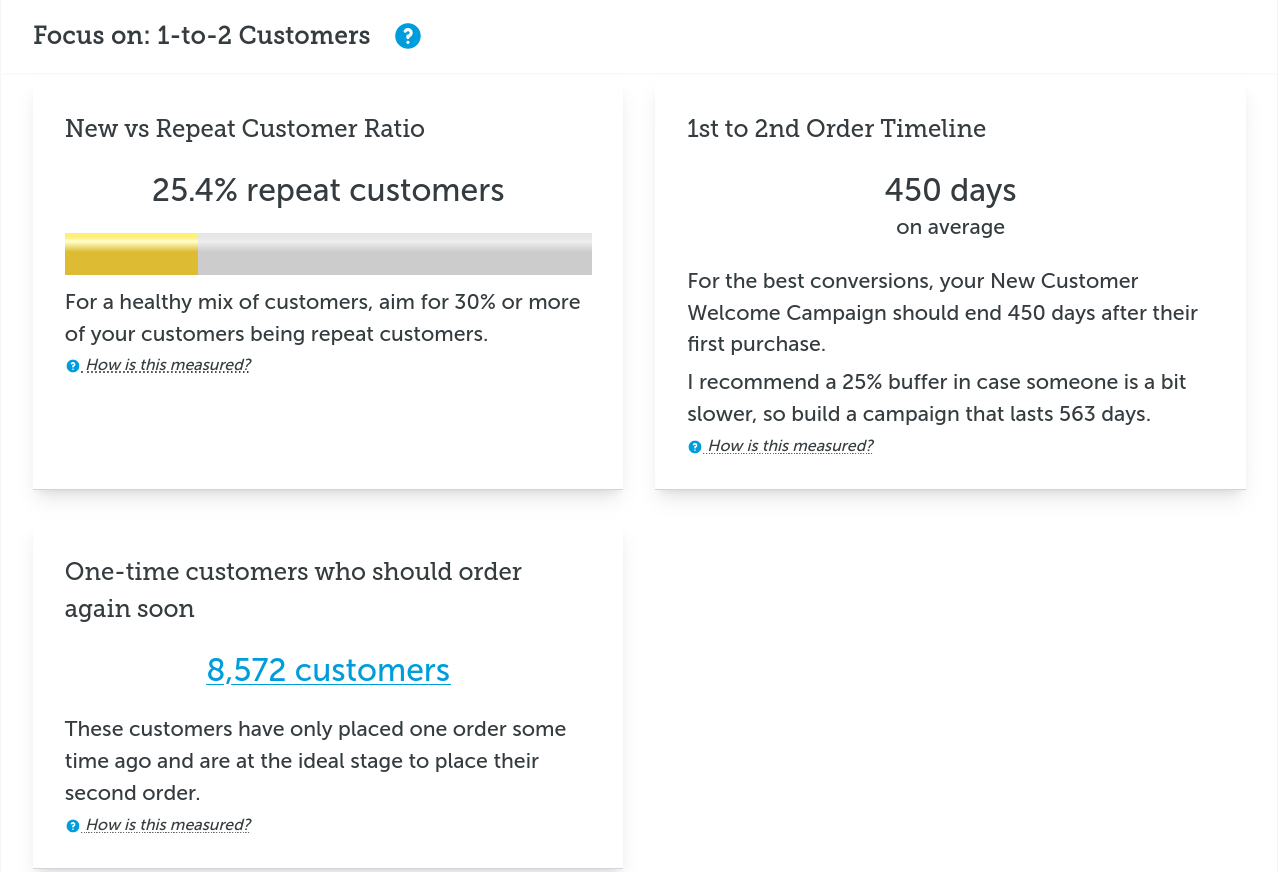
Focus on how to get your new customers to make their second order and become repeat customers.
Downturn
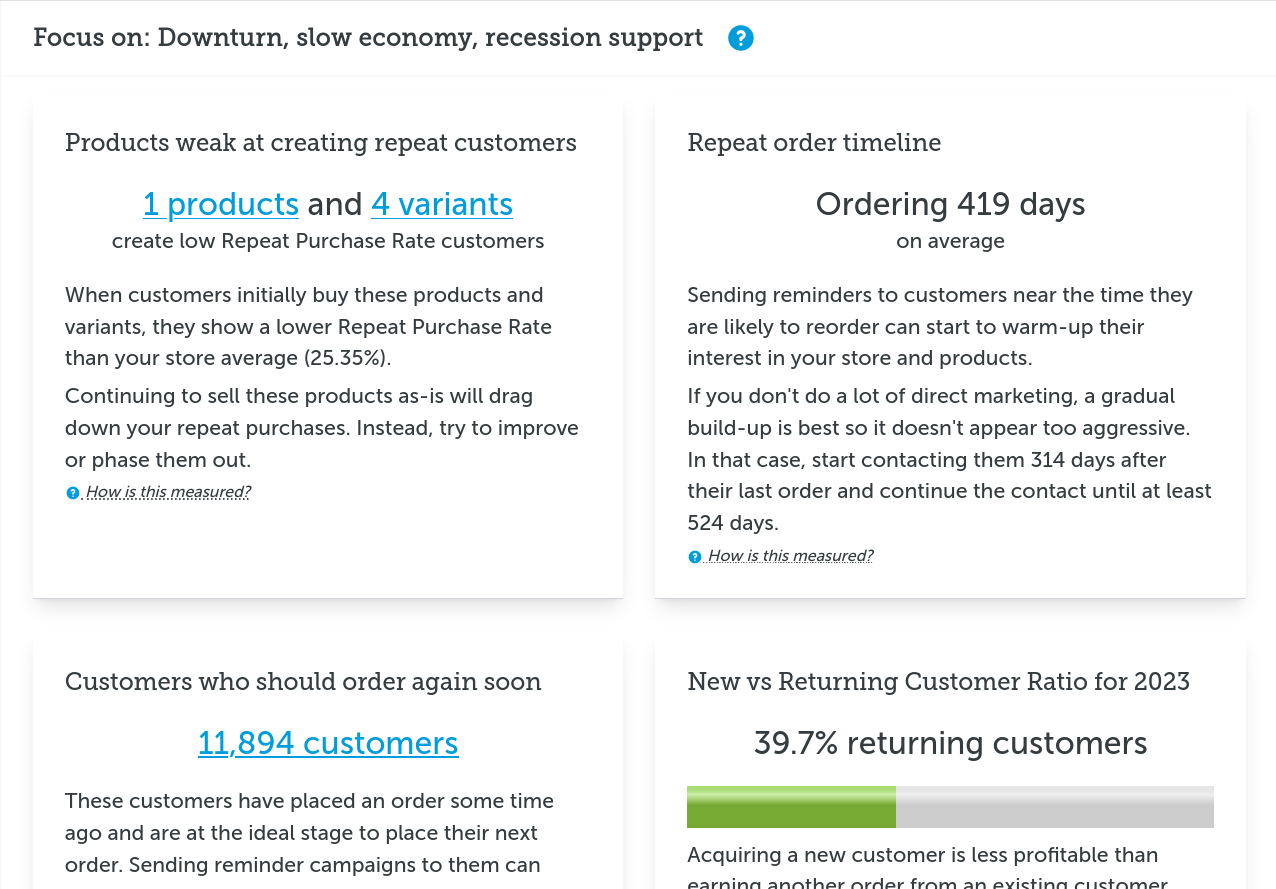
Help your store prepare and survive downturns by operating more efficently.
Average Customer Analysis
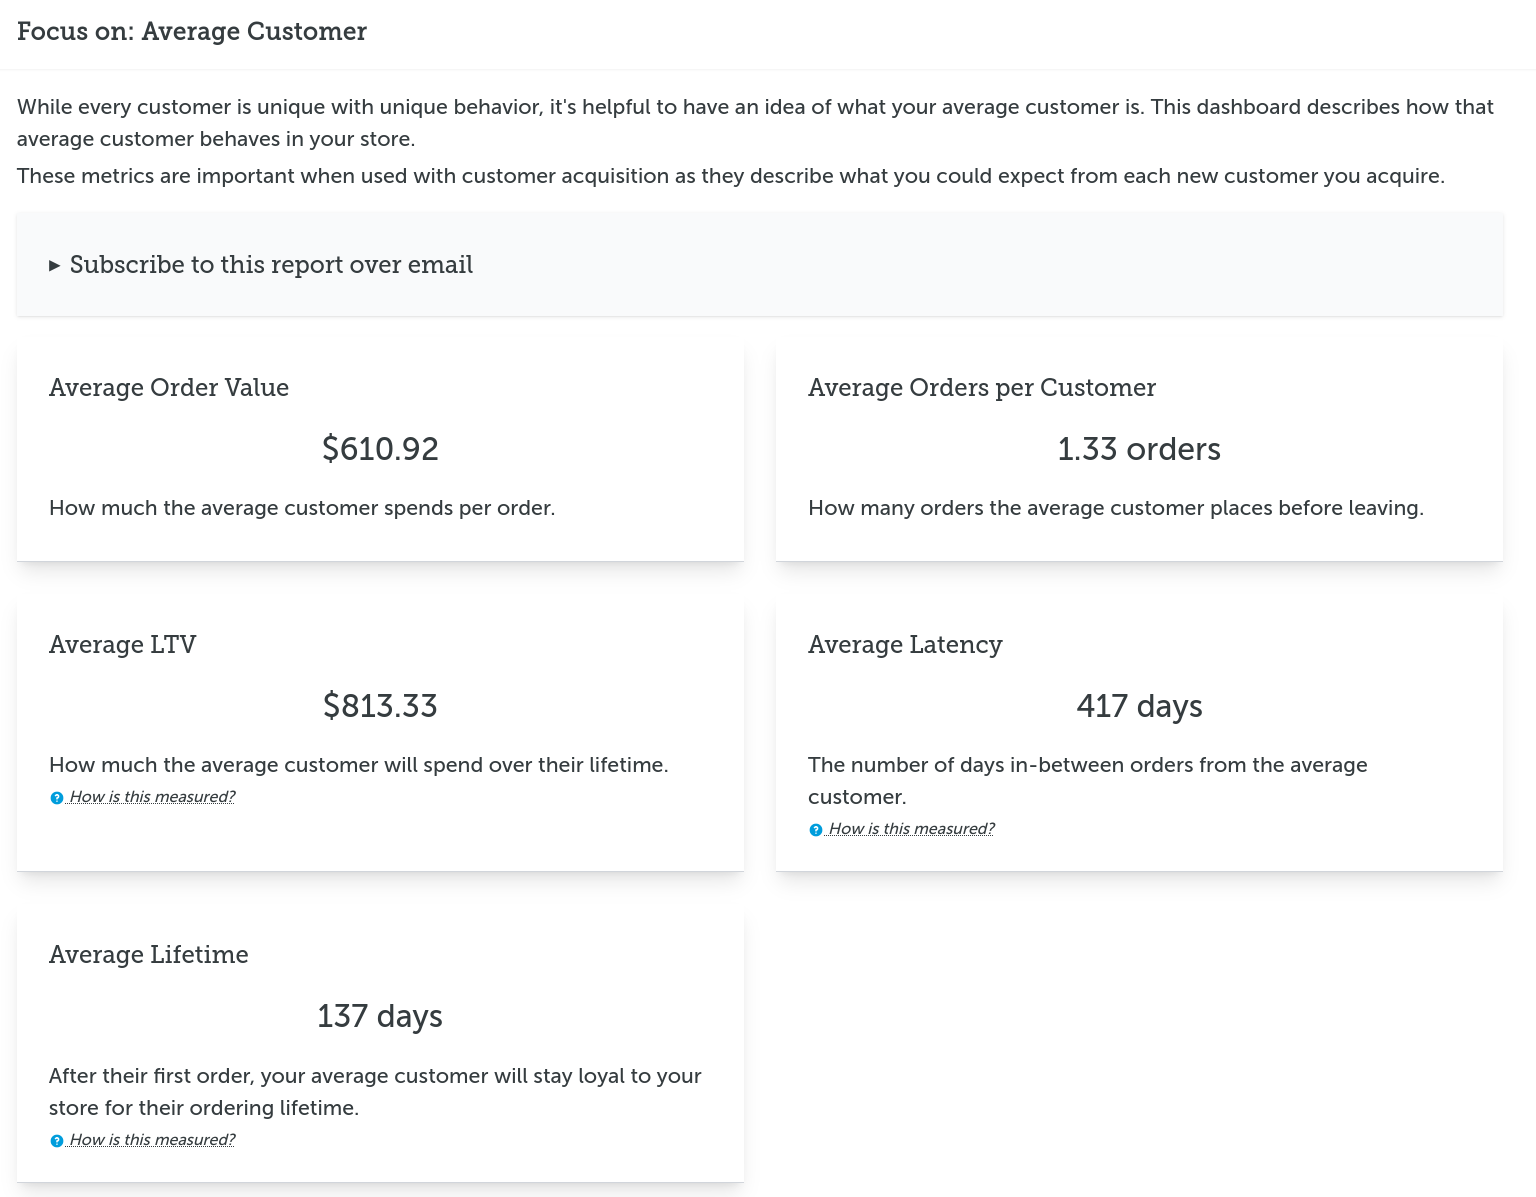
Learn how your average customer behaves and orders.
Winter Holiday
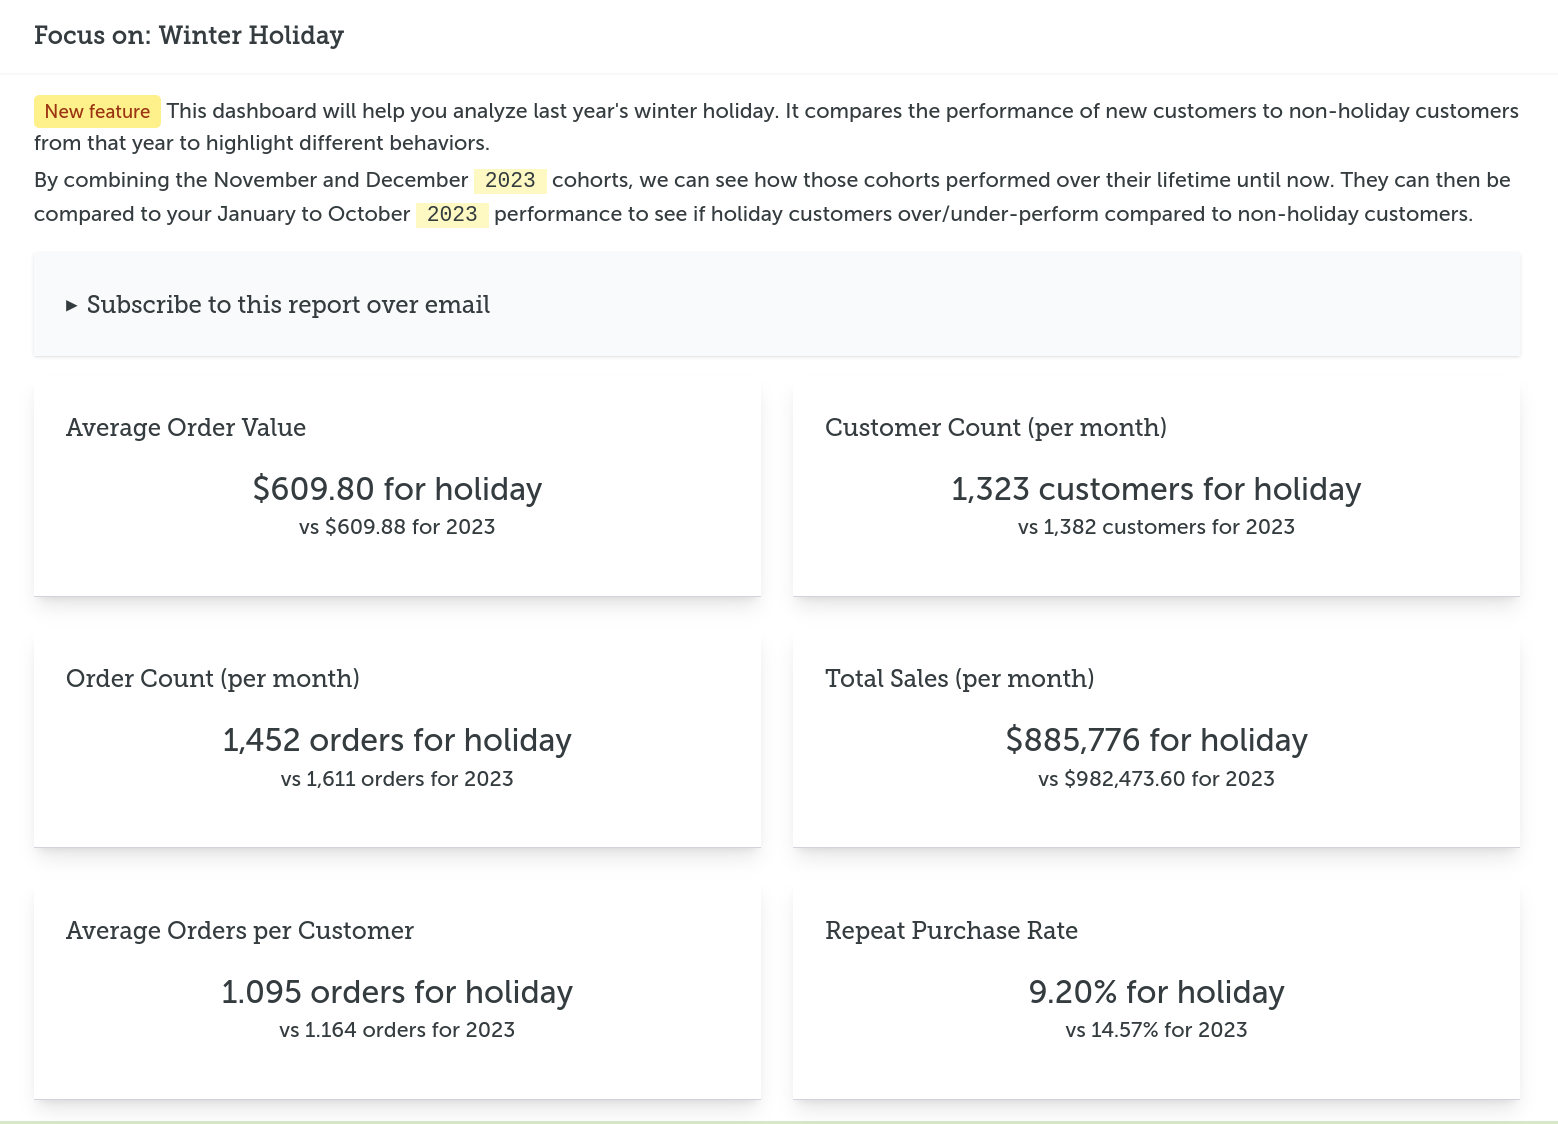
Prepare for this year's winter holiday season by analyzing how last year performed.
Compare last year's holiday customer performance against your regular customers.
Store Analysis
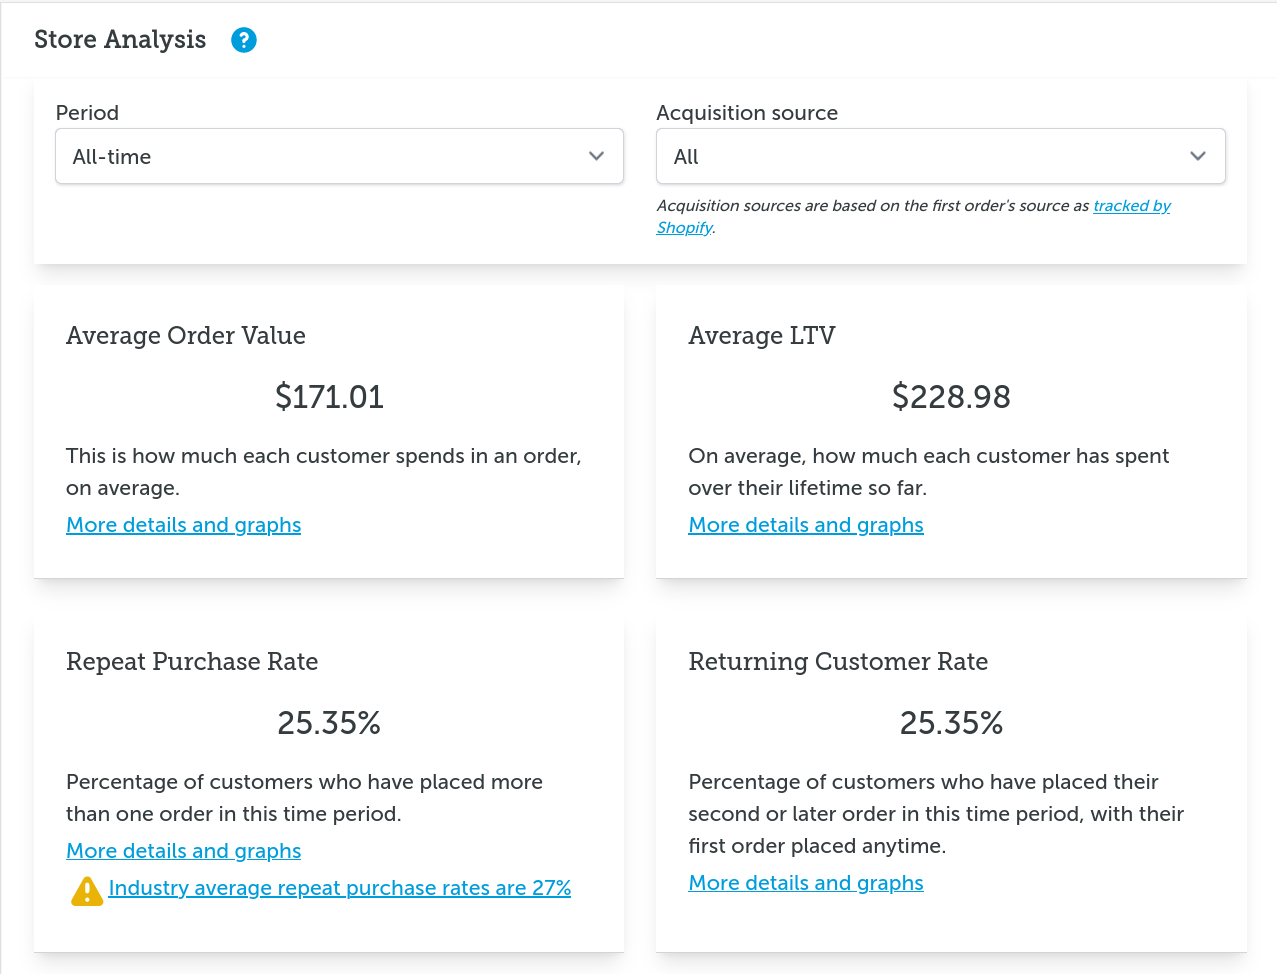
Review your storewide metrics and analyses to be confident you're heading in the right direction.
Customer Segmenting
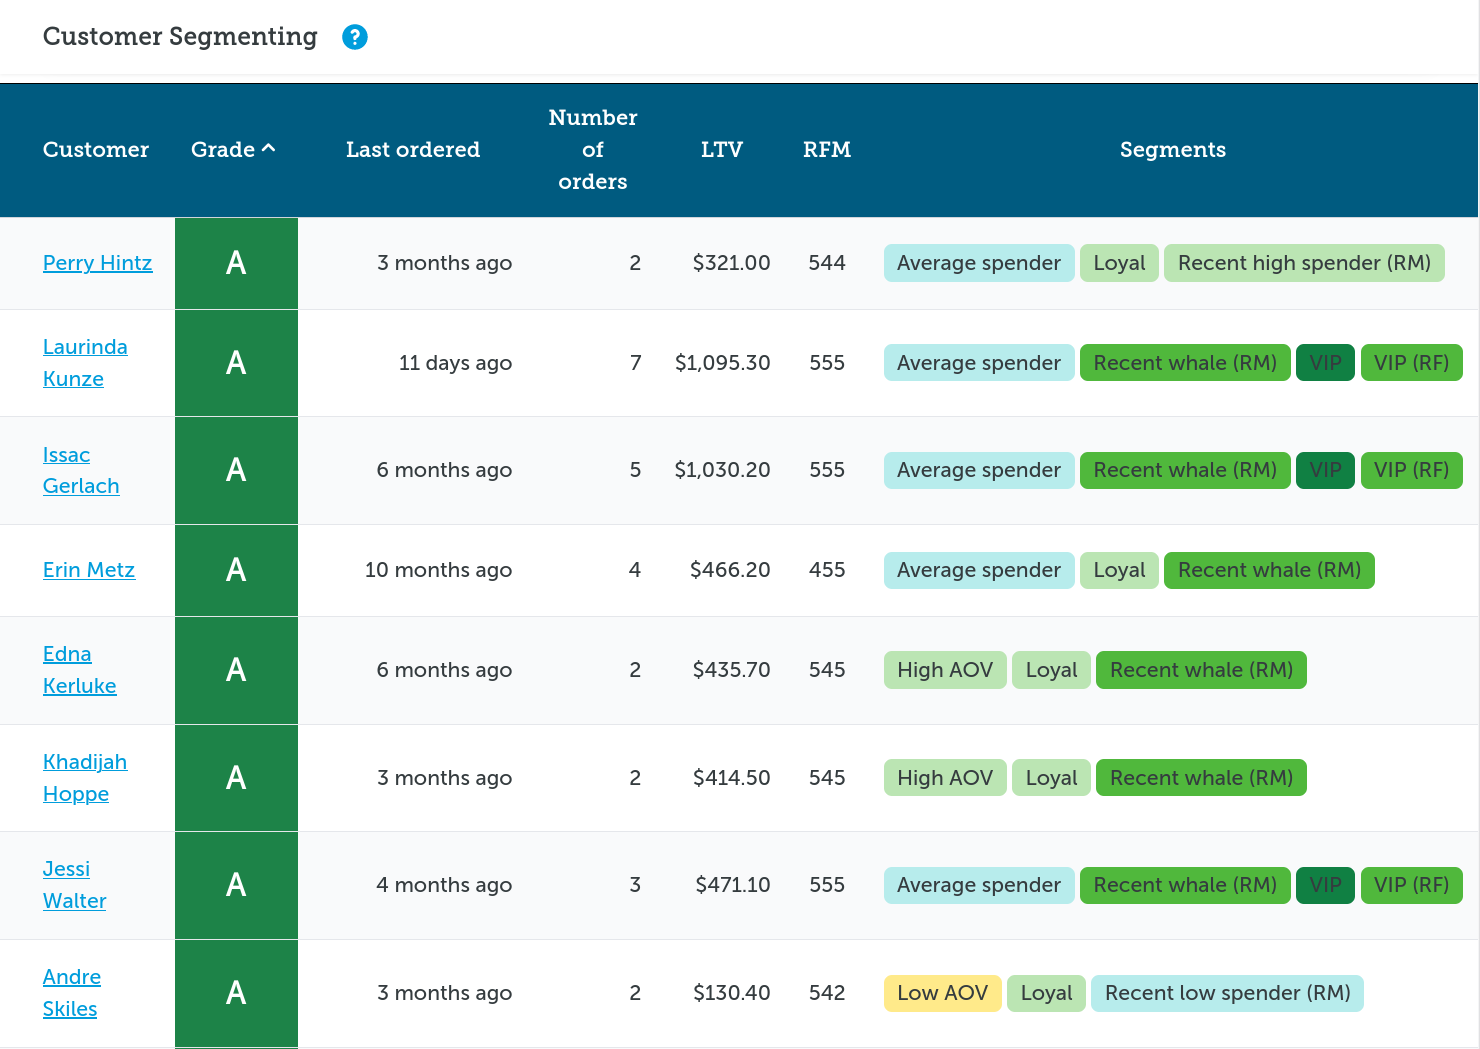
Automatically segment your customer using a variety of industry tested and proven models.
Find who your most loyal and valuable customers are.
Customer Grid
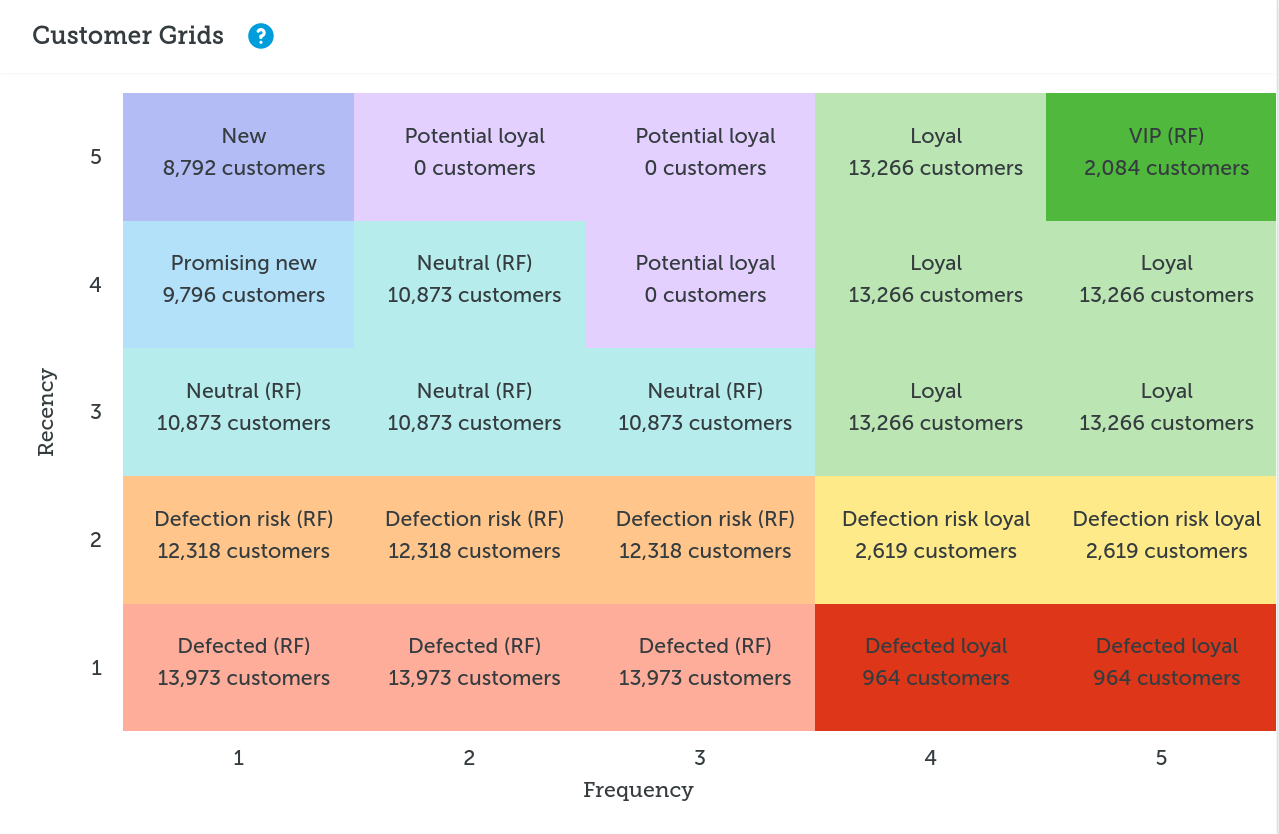
Visualize your Automatic Customer segments and RFM segments and see how customers flow from segment to segment over-time.
Learn how those customers behave and advice on how to market to them.
Order Sequencing Analysis
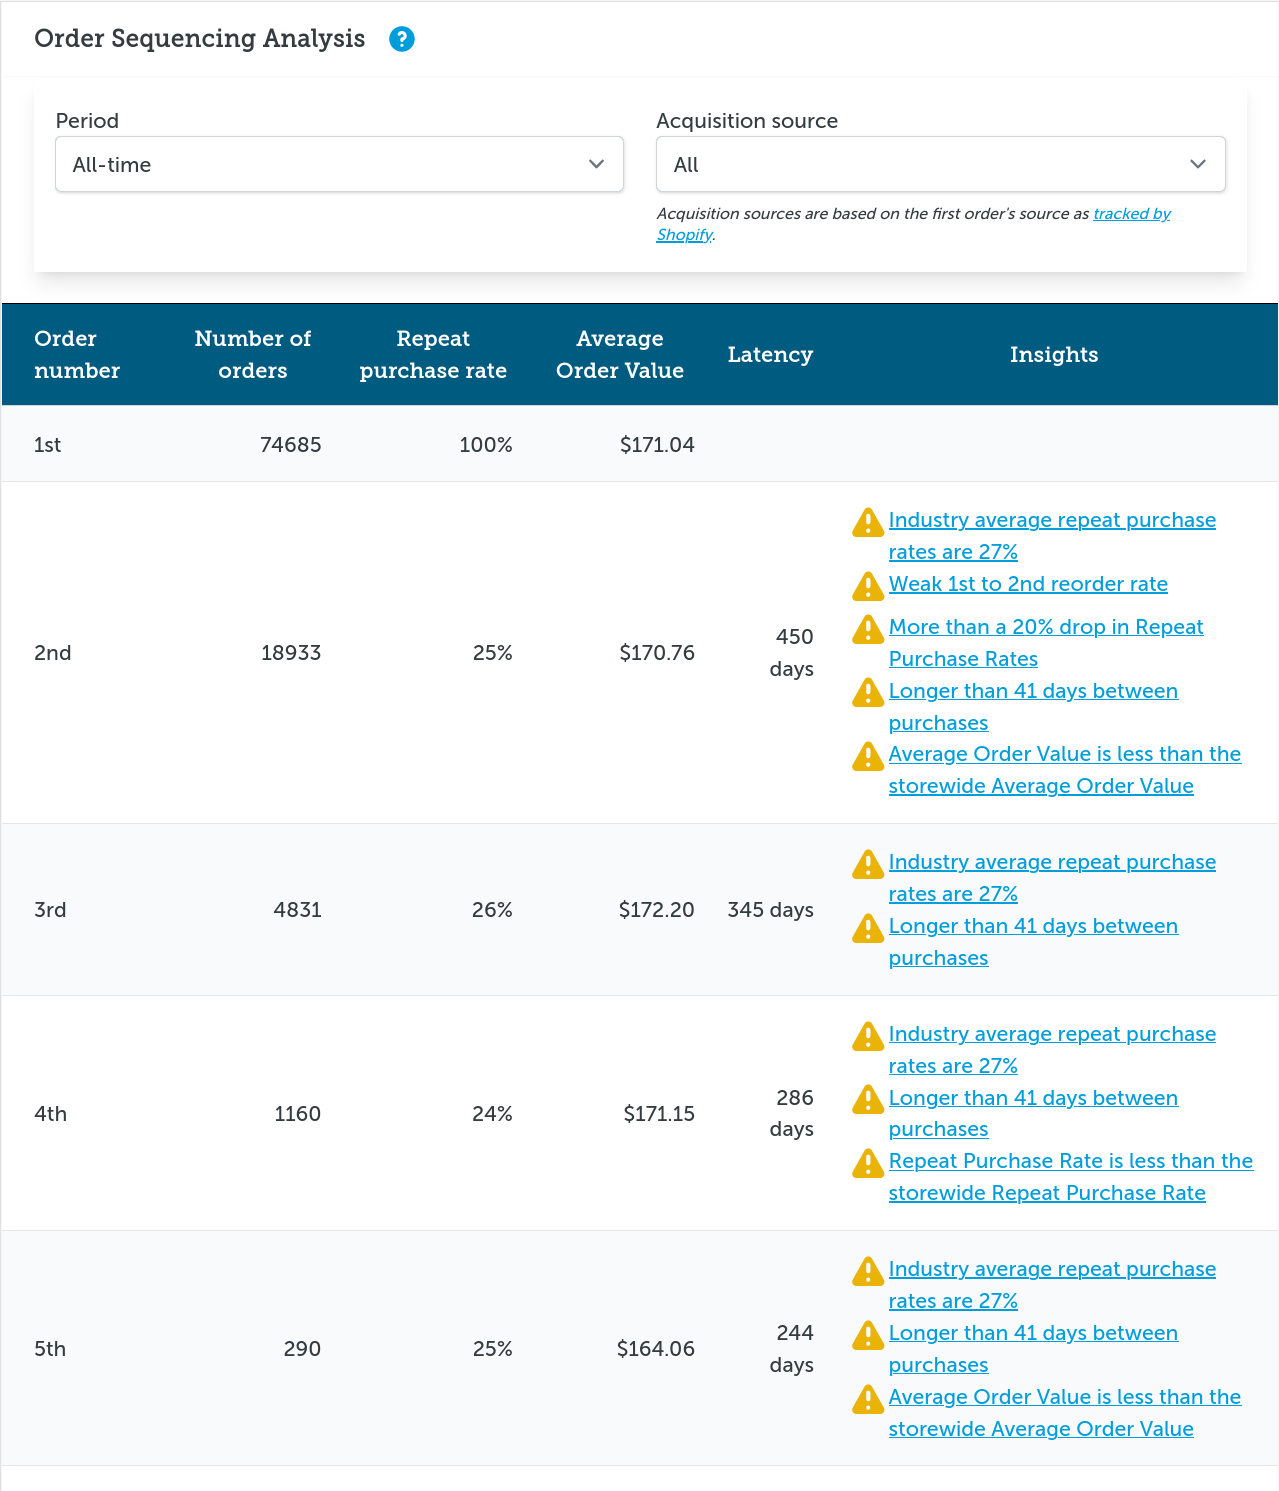
Learn how customer buying behavior changes across their lifetime and which points do they become loyal customers.
Find when to push for a sale in engagement campaigns.
Spot where customers drop off and start to defect.
Cohort Analysis
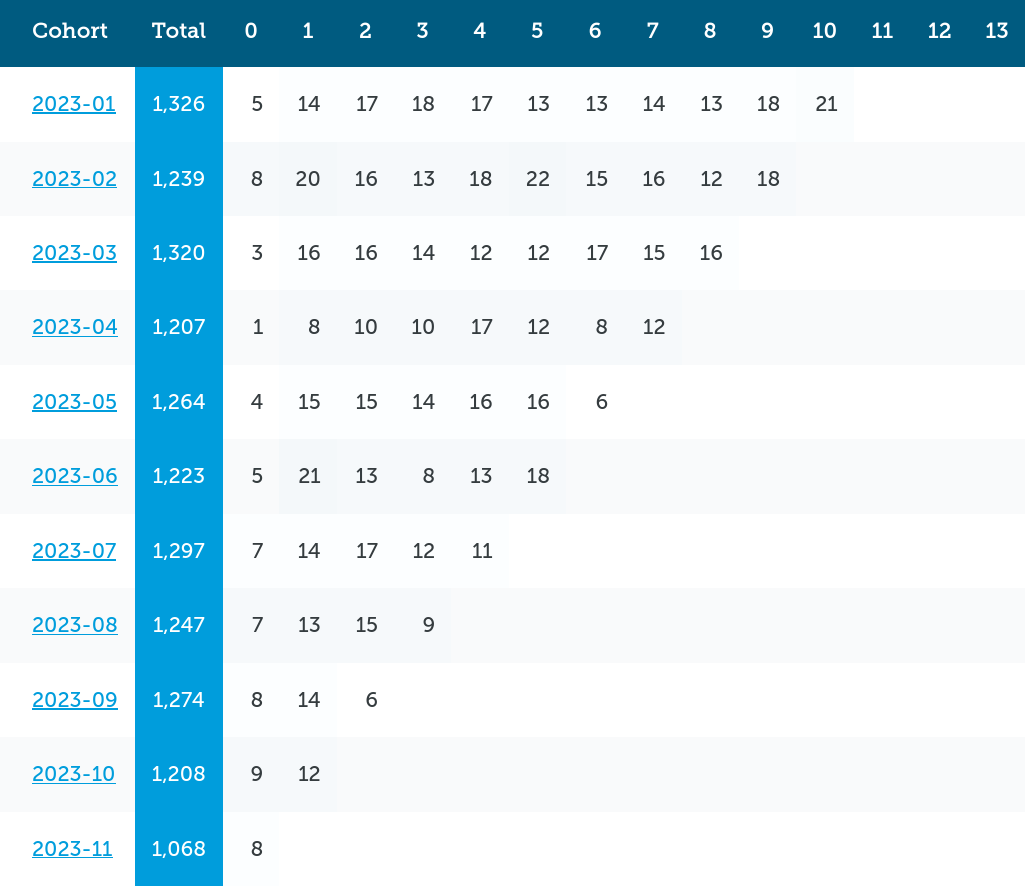
Analyze customers with the cohort analysis to learn how the customer acquisition date influences their buying behavior.
Learn how their buying lifecycle changes from month-to-month and when they disappear.
Product Reorders
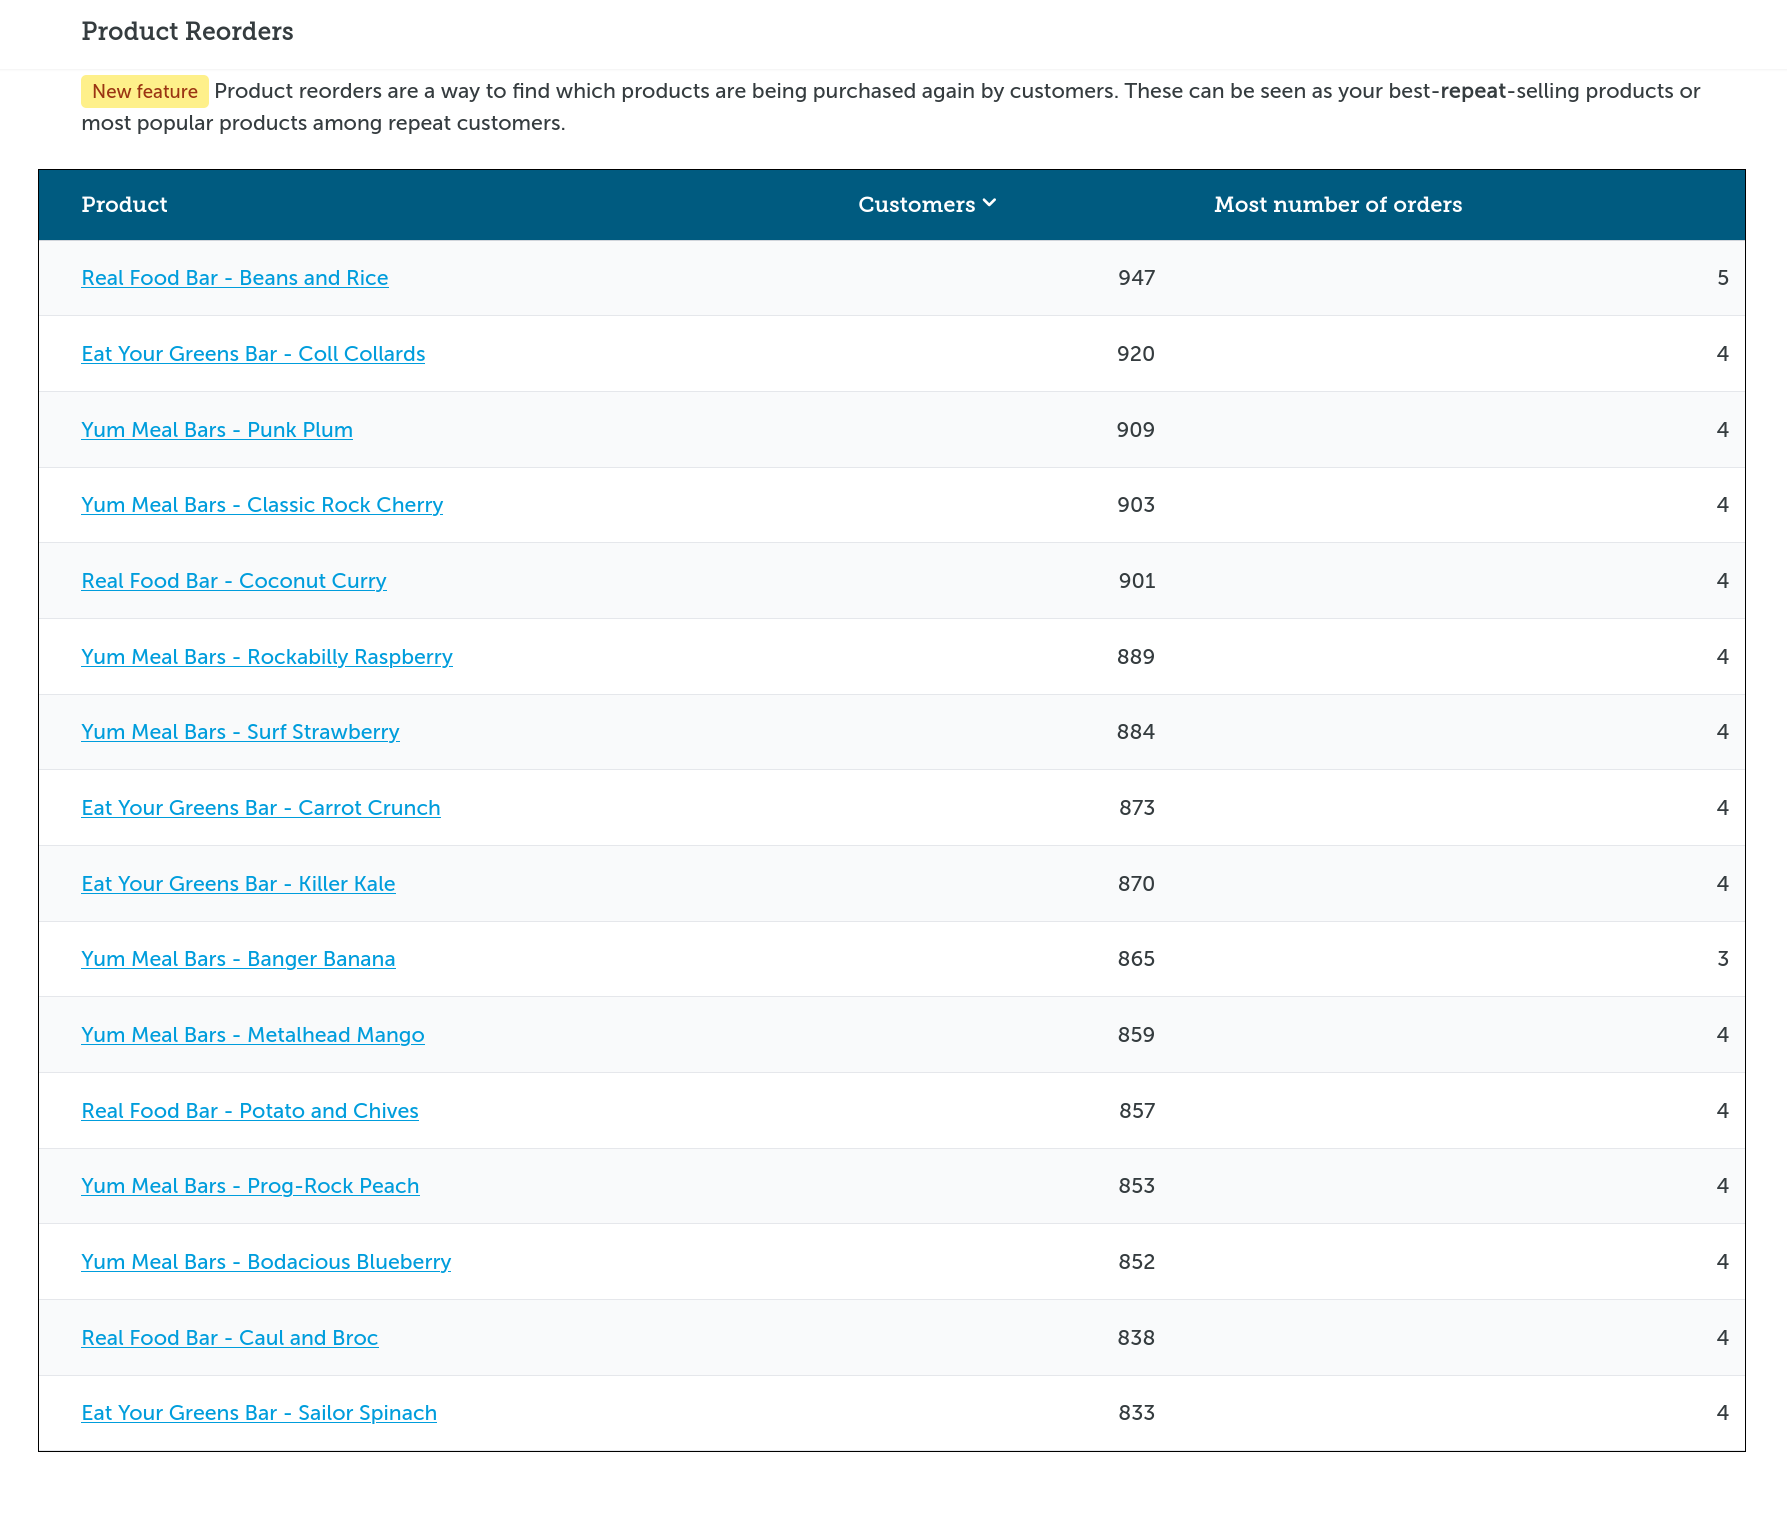
Find which products and variants are purchased over and over again by repeat customers.
Nth product analysis
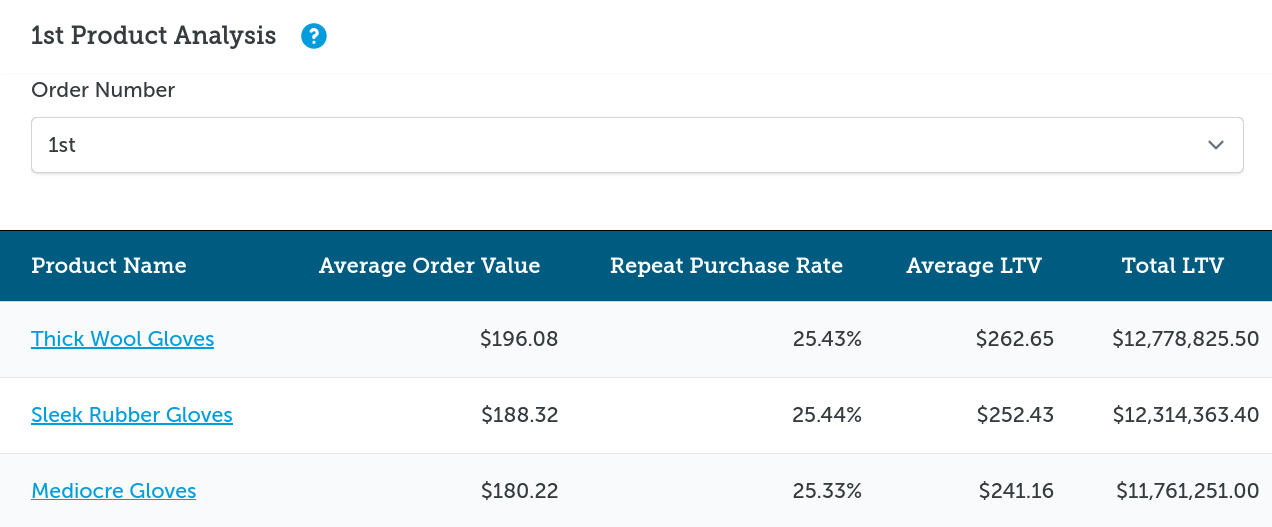
Connect the best customers back to the products they bought to help decide which products are the best for long-term customers.
By highlighting, promoting, and selling your top products at different stages, you are more likely to attract and keep better customers overall.
Metrics
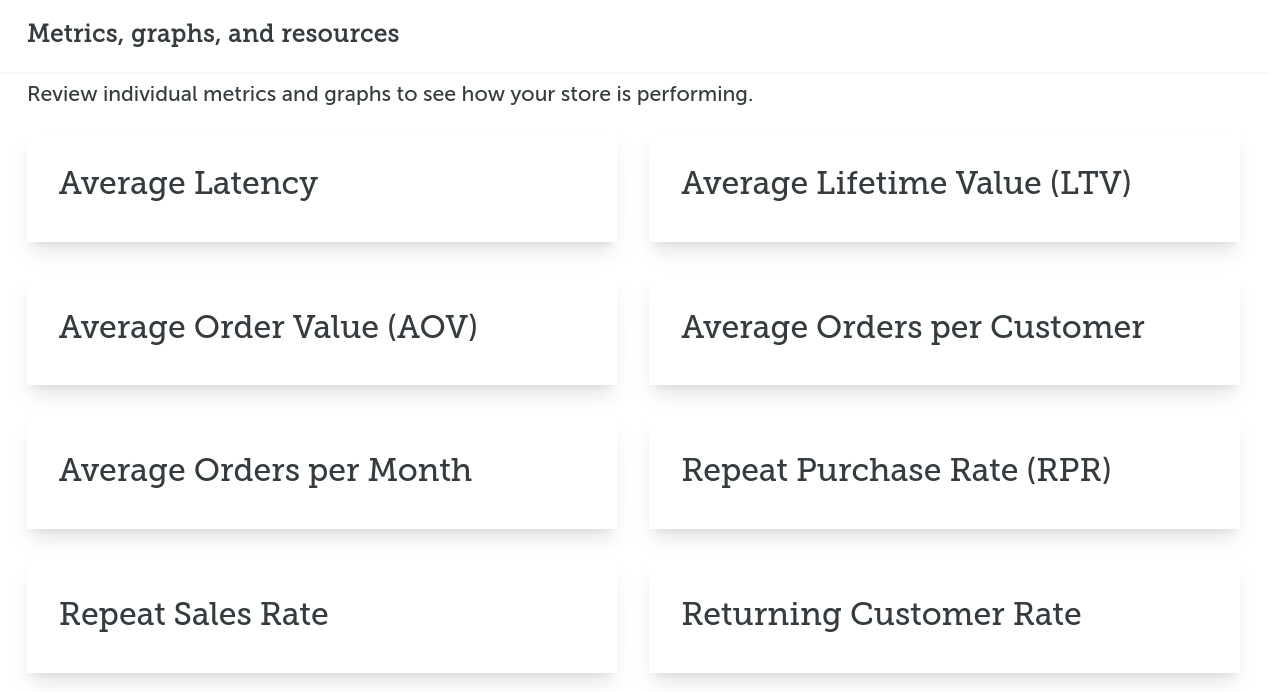
Metrics are detailed and available to review outside of the reports for further analysis.
Email subscriptions
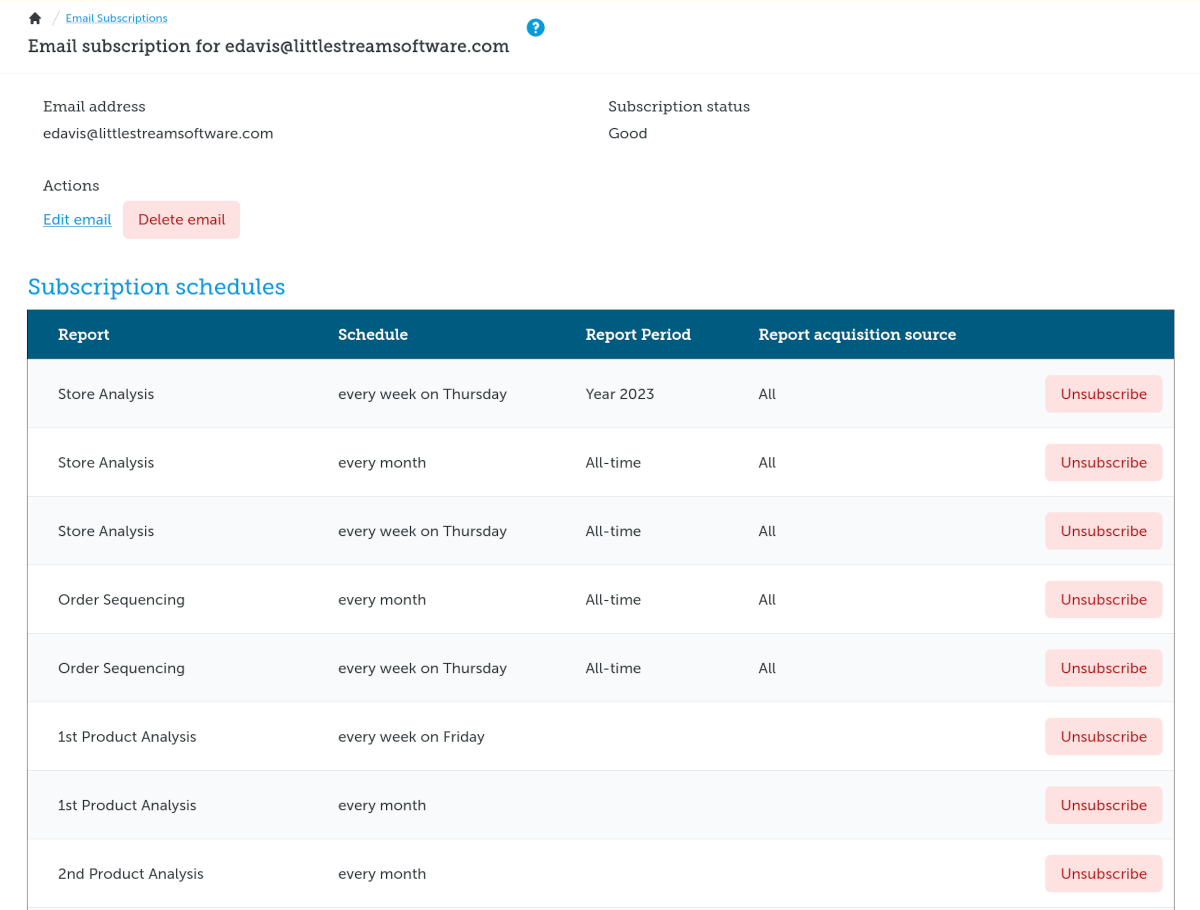
Subscribe to have reports delivered over email to your and your team. Sent:
- Monthly
- Weekly
- Daily
Integrations
- Integrated with Shopify since 2016
- Automatically imports Shopify data and keeps it in sync
- Approved by Shopify to access protected customer data
- GDPR supported analysis