The Nth Product Analysis in Repeat Customer Insights now includes graphs for each product and variant.
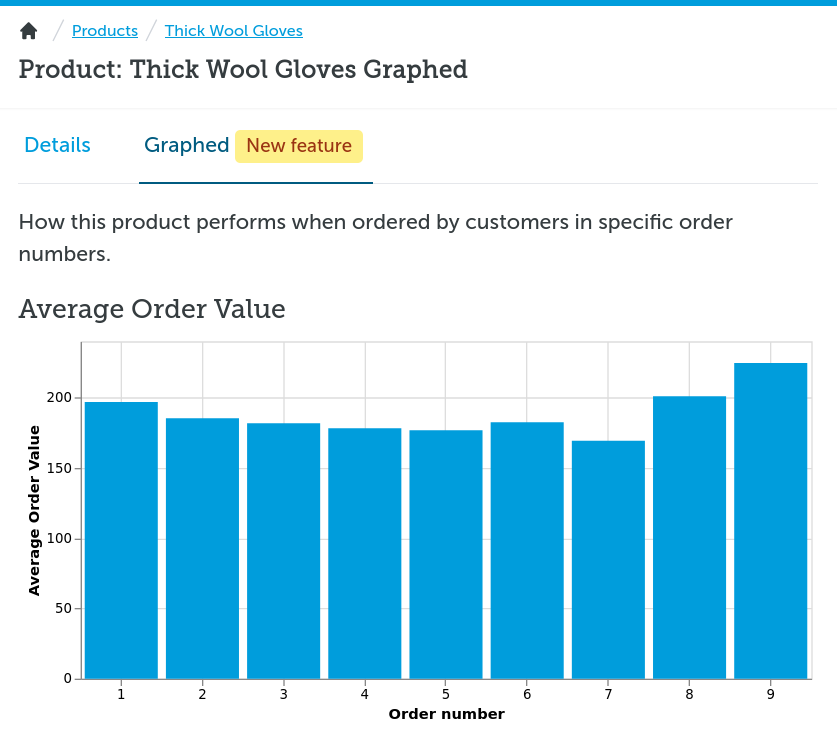
These graphs will let you compare how customer behavior changes based on when a product is ordered. In that example above, customers who buy these gloves in their 9th order have a higher Average Order Value than any other.
The actual graphs compare six different metrics, not just the AOV. You can also check them out in the live demo or if you already have the app, they are live now in the product details.
Each product and variant will have these metrics calculated and graphed:
- Average Order Value
- Repeat Purchase Rate
- Average Lifetime Value
- Total Lifetime Value
- Number of orders
- Number of customers
If you haven't signed up for Repeat Customer Insights yet, it's an easy process. Just give it your Shopify store url and it'll walk you through the setup, import, and analysis process automatically. No code needed.
Eric Davis
Analyze your customer's behaviors before they defect
Your customers aren't yours forever. Some might have defected today, never to be seen again.
You need to analyze your customer behavior so you can reach them before they defect.