A Repeat Customer Insights customer was asking the Cohort Revenue report works.
Here's a set of sample data.
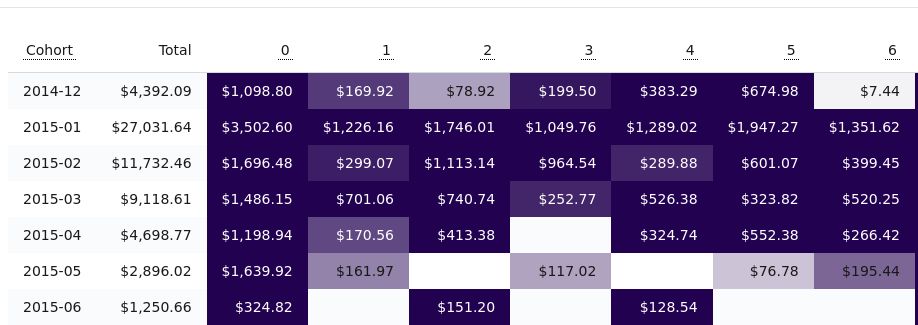
You can see each cohort in a row based on when a customer first ordered. Each row shows the total that cohort has spent along with how much they've spent over time, month-by-month. Each numbered column is how many months after their first order.
For example, using the 2014-12 cohort as an example, this store had new customers who placed $1,098.80 in orders in December of 2014. Month 0 column represents the month of the first order by those customers.
Those customers now belong to the cohort group of 2014-12 for the rest of their lifetime.
The next column for that cohort, under Month 1 is $169.92. That means of those customers in the cohort, some came back one month later (January 2015) and made $169.92 in purchases.
The next column for Month 2 says they spent $78.92 in February 2015. And so on..
Over the entire time, those customers have spent $4,392.09. (There's many more columns and rows I cut from this screenshot)
A month will be blank if there were no orders for that cohort in that month. For example, Cohort 2015-06's Month 1 column. It will also be blank if the date is in the future.
This report gives you a good idea of when your most valuable customers are first ordering and when they are ordering. They might be from an ad campaign you ran years ago and keep on buying.
Combining this version of the Cohort report along with the customer count and AOV versions lets you visually see what's going on with different segments of customers over time. It's also one of the clearest ways to spot seasonal trends.
Eric Davis
Leaky funnel losing repeat customers?
Are you struggling to grow your repeat purchases? Install Repeat Customer Insights to equip your store with the insights it needs to increase your repeat sales.