Preparing your store for the winter holidays can get chaotic. There's so many moving parts and you're required to adapt while sticking with an overall plan.
Repeat Customer Insights and its models can help out but I've added something new to make it easier: the Winter Holiday dashboard.

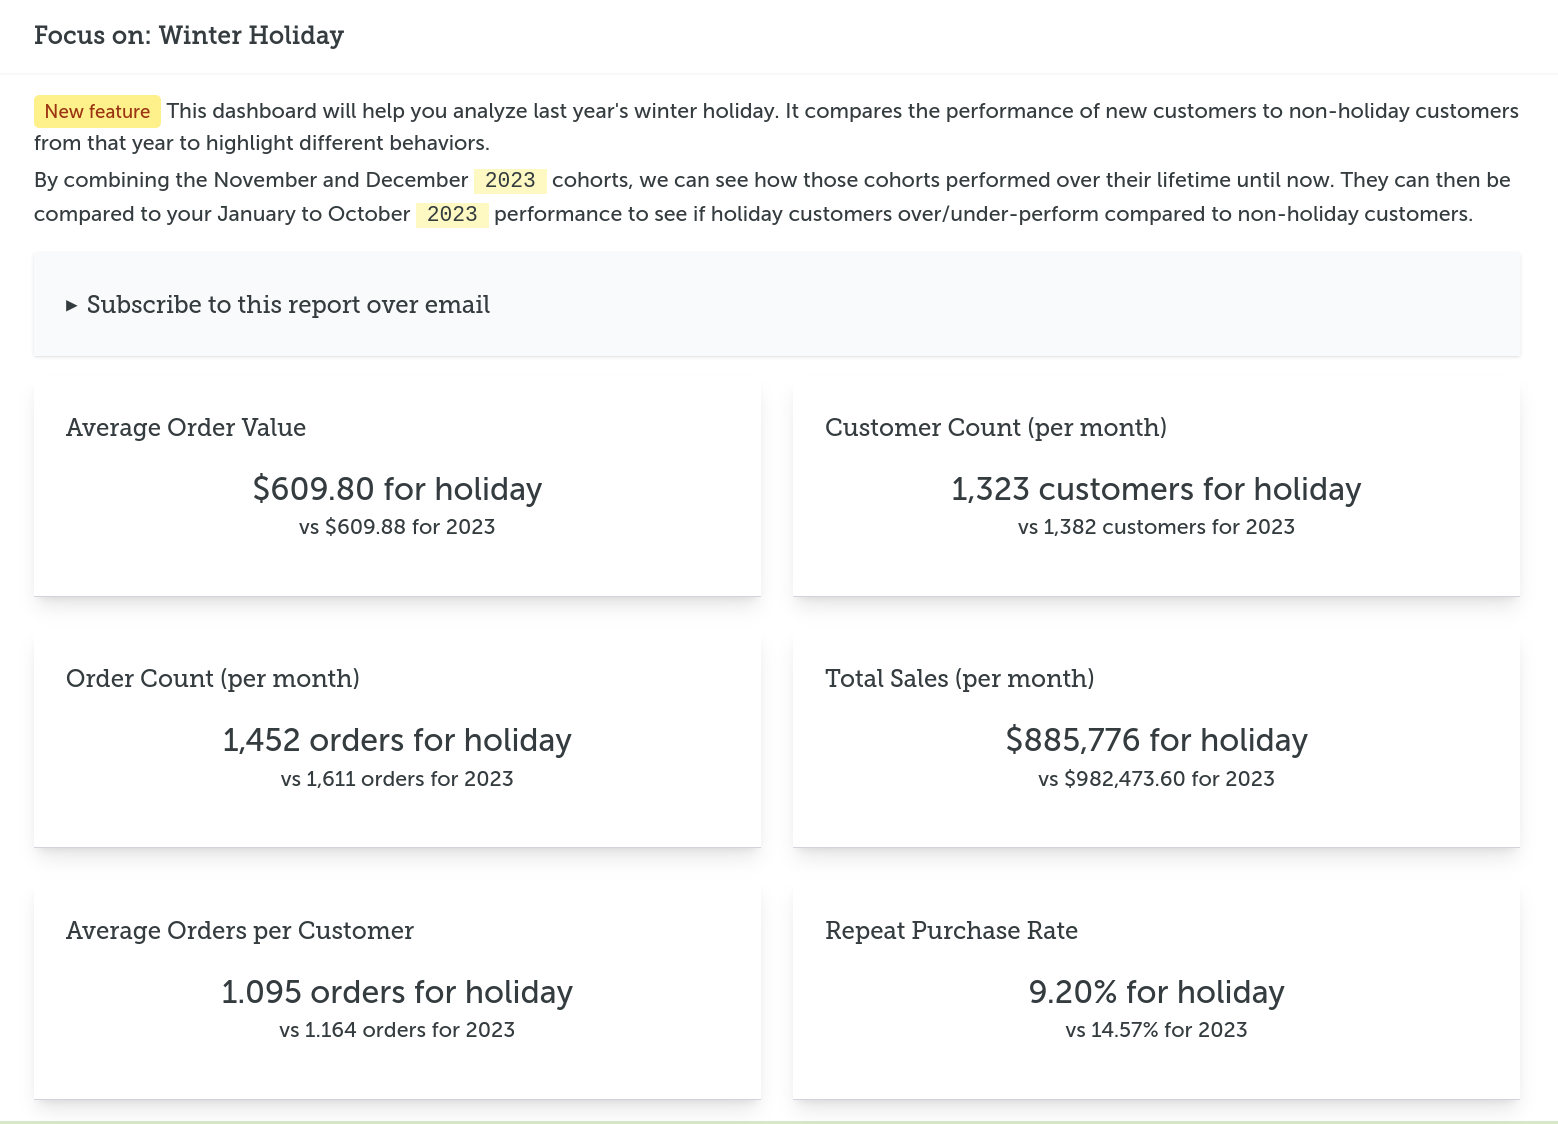
This dashboard summarizes some key metrics that you need while planing, like Average Order Value, Total Sales, etc.
How it summarizes those metrics is unique. Instead of just using your current values, it looks back at the last November and December to compare how newly acquired customers behave vs the rest of the year.
So in 2024 you'd be comparing customers acquired in January 2023, February 2023... though October 2023 against November and December 2023. Did those holiday customers place larger orders? How often have they come back to reorder? Are they more or less loyal?
This dashboard should help you see the differences between a customer acquired during the holiday versus a regular one.
All stores who have access to the cohorts and Focus Dashboards in the app can start using this right away. It'll also be updated as the year progresses and handle the 2024 holiday season automatically.
If you're not a customer yet, there's a demo version with sample data you can poke around or you can sign-up for the 14-day free trial.
Eric Davis
Leaky funnel losing repeat customers?
Are you struggling to grow your repeat purchases because your customers keep defecting? Use Repeat Customer Insights to find out where in their lifecycle you're losing them.