Matt asked how to read the cohort report in Repeat Customer Insights:
Can you explain how the Customers orders by cohort chart works?
Let's use an example:
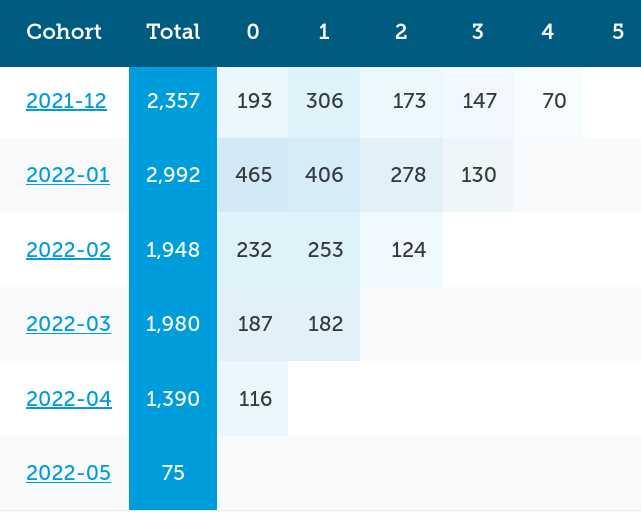
The app segments customers into cohorts based on the first month they order in. So for example, all of the new customers who first ordered in January 2022 will be assigned and shown in the 2022-01 cohort.
The total column shows the number of customers in that cohort (2,992). In other words, how many new customers first ordered in that month (e.g. January 2022).
Each of the next columns shows how many of those customers ordered in a later month. For example, the 1 column will show 406 of those customers ordered again 1 month later (February 2022). The 2 column is two months later (March 2022) and so on.
The 0 column is the odd one, as that shows how many customers ordered again in their initial month (January 2022). 465 customers in this example.
Future months will be blank and it'll look like a reverse staircase on the right edge from that effect.
The other cohort reports in the app work the same, except instead of reporting on how many customers ordered each month they report on the Revenue and Average Order Value (AOV).
You can also click on the Cohort identifier on the left and see details of that cohort. The table there is another view of the different cohort reports but from the perspective of this specific cohort group only (Unique customers who ordered column is the Customers orders by cohort report, Revenue column is the Revenue by cohort report, AOV column is the Average Order Value by cohort report).
On the main report you can also turn on percentage views which makes comparing different cohort sizes easier.
Don't worry if it takes a bit to grasp, cohort reports are very information-dense. I found it's easier to look at the most recent cohorts first as they'll have less historic data (some customers have data going back to 2010).
If you'd like to have help building a cohort report, Repeat Customer Insights will create them automatically from your Shopify data.
Eric Davis
Track down which customer cohorts perform the best
Different groups of people behave differently. Repeat Customer Insights creates cohort groups for you automatically to see how your customers change over time and spot new behavior trends.