There's the business maxim that says it's easier to win an order from a repeat customer than a new customer.
But is it worth it?
Here's one way you can check to see if you should be focusing on your repeat customers.
What you're going to do is to look at the Average Order Values (AOV) for new customers, returning customers who placed a second order, and repeat customers who have placed multiple orders.
The easy way to get these numbers is to use Repeat Customer Insights and the Customer Purchase Latency report because they are right there in clear view.
But here's another way to get that data from your built-in Shopify reports. You'll have to massage the data a bit to get the answer, but it's do-able.
-
Go to Analytics and then Reports.
-
Open the Average order value over time report.
-
Pick a date range, I recommend at least three months but twelve months is also great.
-
Change Group by to None
-
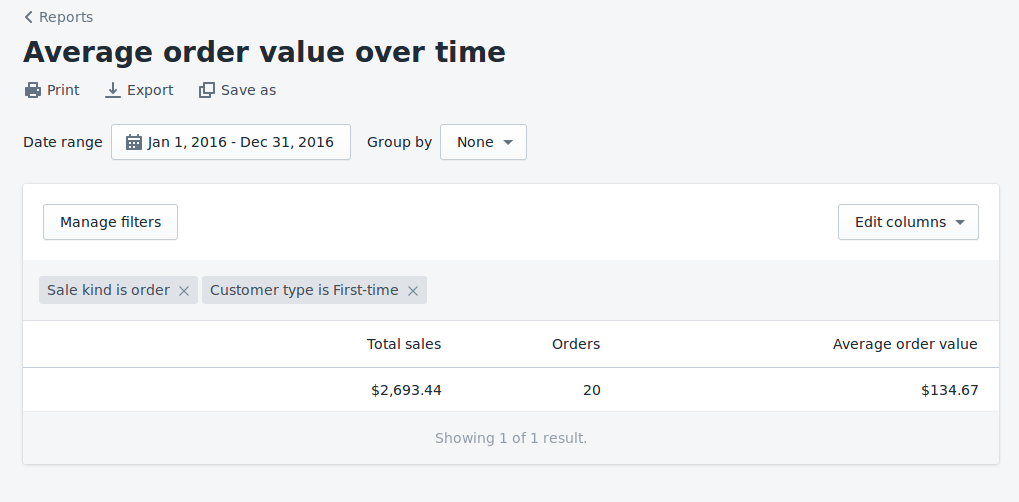
Add a Filter for the customer type: First-time.
You should get a result like this.
-
Note down the Average Order Value for first time customers.
-
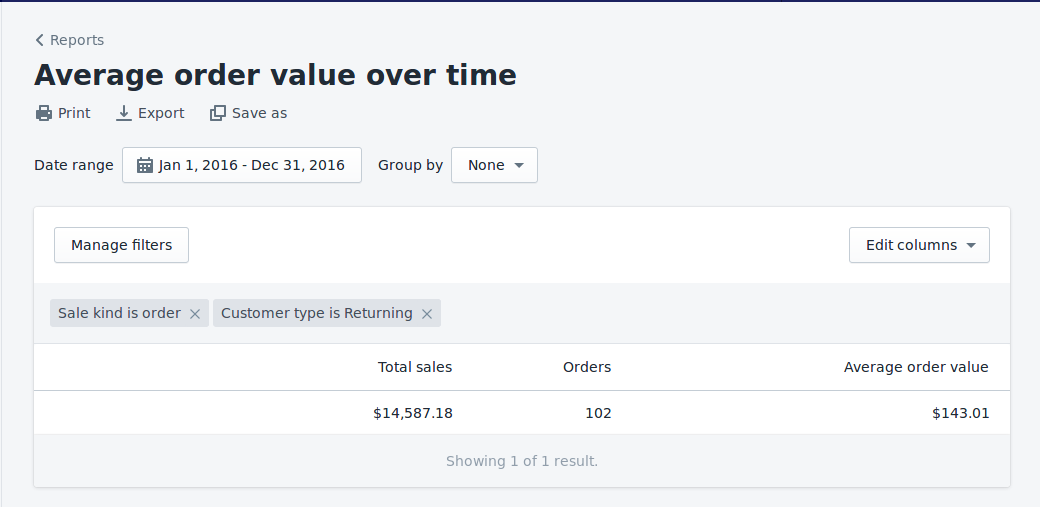
Now change the filter to be for Customer type is Returning.
-
Note down the Average Order Value for returning customers.
- Now you can compare the two values to see if returning customers are more valuable than first-time.
This calculation should be good enough to get an idea about how your Average Order Value changes for these two customer segments, but there are a few issues with Shopify's version of the report.
First, it's counting customers who are returning customers and who are first-time customers. It's not looking at them as who they were at the time of the report's date.
That means if you go far back into your order history, it'll over-report on returning customers. That's because a customer who ordered in the past and ended up ordering again more recently would be counted as a returning customer back then. That means the values in this report will change from day-to-day, even though it's supposed to be historic data.
This report doesn't let you segment the types of returning customers.
Shopify defines a returning customer as a customer who has placed at least one past order. So it treats two customers the same, even if one customer has only placed two orders while another has placed over 100 orders. A better way is to segment out the two order customers (returning customers) from the others (repeat customers).
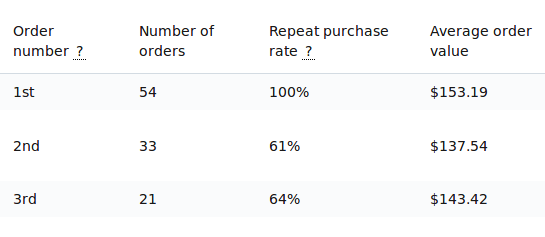
That's two reasons why it's better to use Repeat Customer Insights to collect this data. It uses your customer behavior at the time of the order to calculate the different Average Order Values which makes it more correct and much more actionable.
Notice how different the numbers are from the ones we calculated? This is the exact same store with the exact same date and data. But a completely different story.
In this store, repeat and returning customers are slightly under-performing new customers. This could be due to what merchandise they're ordering or you could be over-discounting on repeat orders.
Whatever the cause, you're now armed with data to make a hypothesis and support any decisions you make.
If you haven't installed Repeat Customer Insights yet, it can make this entire process easier.
Eric Davis
How do your products determine customer behavior
In Repeat Customer Insights the Customer First Product analysis will measure customer behavior based on the products each customer first ordered.